Weather forecast embed for outdoor attractions.

When generic weather apps show all-day rain, guests can cancel before your gates even open. Still Worth Going shows forecast only during your opening hours, in visit-time slots, plus covered attractions when showers hit.

Add your hours. List what is covered. Paste one snippet on your homepage, booking journey, modal, or side tab so guests can check weather without leaving your site.

Clearer weather context can recover lost intent before it turns into a lost booking.

See the problem Start free trial

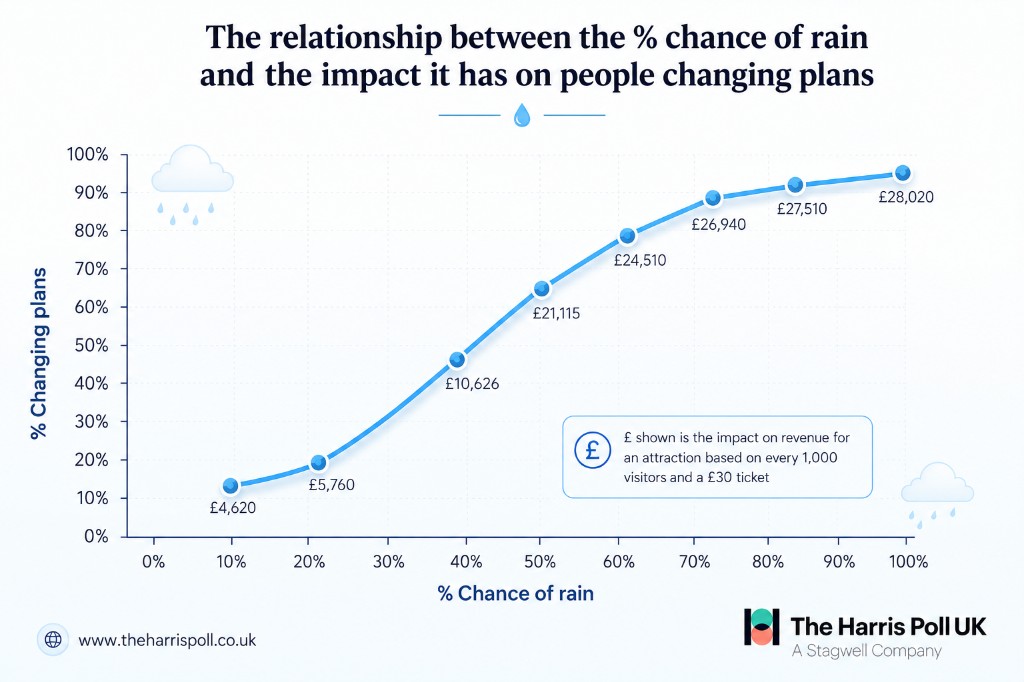
Line graph from The Harris Poll UK: as chance of rain rises, percentage of people changing plans rises sharply between 30% and 60%
The problem

At 8am they see rain. By 10am you're dry. Booking already gone.

A generic weather app can compress a whole day into one rain icon. For outdoor attractions, that can kill intent before your opening hours even begin. Still Worth Going replaces that vague all-day signal with weather for actual visit hours.

🌧️ Generic weather appToday
6:00 am🌧️
8:00 am🌧️
10:00 am
12:00 pm☀️
2:00 pm☀️
"Looks like a washout — let's skip it."
But you don't open until 10am. By then it's clear — and the booking is already lost.
☀️ Still Worth GoingOpen 10am–5pm
10–11:30am☀️
11:30–1pm☀️
1–2:30pm🌤️
2:30–4pm☀️
4–5pm☀️
"Clear skies the whole time we're open."
Only the hours that matter — so the forecast tells the true story of a visit.
How it works

Show weather that matches actual visit hours.

Still Worth Going is simple: define when you are open, show guests forecast in visit-time slots, and surface covered attractions when weather turns. No need to send guests off to a generic weather app that tells only half story.

1

Add your opening hours

Set default hours, then refine for seasons, closures, and one-off dates when needed.

2

List covered attractions

Give guests confidence by showing what stays enjoyable when showers roll through.

3

Paste one snippet

Embed on homepage, booking page, modal, or side tab to keep weather context on your site. See example sites.

<!-- paste before </body> -->
<div data-swg-venue="chester-zoo"
data-swg-api="https://data.stillworthgoing.com"></div>
<script src="https://stillworthgoing.com/swg-embed.js" defer></script>
This week at Style Segments
Covered if it rains: Monsoon Forest, Fruit Bat Forest, Elephant House
Weather data by Open-Meteo

Live example. Switch venue, style, and time segments to preview homepage-ready layouts. Try camera for snapshot, modal, or side tab on right edge. Or open the example sites to compare placements.

87%
of UK adults would change or reconsider plans when a rain icon appears on a weather app
55%
would opt out when the forecast shows just a 40% chance of rain
£123k
estimated daily revenue lost when wet forecasts deter guests
The Harris Poll UK, March 2026 · Survey of 1,000 UK adults
Proof

Check how often all-day rain signals could have cost visits.

Search your attraction. We compare 7-day-ahead forecasts against what actually happened, highlighting days when a typical weather app would show rain but your opening hours stayed dry.

What it does

Built around weather questions guests actually ask.

Is it dry when we arrive? What about mid-visit? If showers hit, is there still enough to do? Still Worth Going answers those questions inside your site.

🕘

Clocks off when you do

The embed only forecasts inside your opening hours. No more lost bookings to a downpour that's gone before you open.

⛱️

A rain plan, built in

List your covered attractions and the embed surfaces them so guests know there's plenty to do undercover.

⏱️

Slot by slot, not day by day

Hour-band detail across your day, so a bright afternoon never hides behind one grey morning icon.

📐

Responsive, 1 to 14 days

Fits width you give it, from compact single-day placements to wider multi-day layouts. Live and regularly updated forecast data.

Show it your way

Inline near your booking journey, as a popup, or as a side tab — then grab a snapshot for social and print.

🧭

Homepage widget

Designed first for attraction homepages, especially close to book-now CTAs where weather confidence helps complete the visit.

🪟

Modal popup

Open from any button, or auto-show after inactivity or another trigger you choose. Fits booking pages and CTAs without eating layout space.

📌

Side tab

Fixed edge tab guests open anytime. Out of the way until needed — left or right, resizable, and useful when homepage space is tight.

📷

Forecast snapshots

One click downloads a clean forecast image for social posts, email, and print.

📏

Flexible segment depth

Choose simpler or more detailed time segments so forecast detail matches space available and how much guidance guests need.

🧱

Prime-space friendly

Use inline, modal, or pullout layouts so guests can check forecast without leaving your site for a generic weather app.

ROI calculator

What one rain icon could be costing you.

Use conservative Harris Poll data plus a simple monthly misleading-days assumption to estimate revenue at risk, and how quickly a £49/month embed can pay for itself.

Based on Harris Poll UK findings that up to 82% of guests could opt out on a 60% rain forecast, plus a conservative assumption of 3 misleading rain-icon days per month.

revenue at risk in a typical month of misleading all‑day rain icons

Enter your numbers to see how few recovered guests it takes to cover £49/month.

Harris Poll UK (March 2026) estimates that with 1,000 daily guests spending £30, a 60% chance of rain could see up to 82% opt out – £24,510 lost in one day. We scale that scenario to your attraction.

Pricing

£49 per month, per venue.

One simple plan. Start with a 30-day free trial, then £49/month per venue.

Start free trial

Stop losing bookings to misleading forecasts.

Give guests the forecast for your opening hours — not a whole-day summary that scares them off.

Start free trial